Machine learning and Pattern recognition approaches on Prostate Cancer data
- RUTURAJ Raval

- Apr 29, 2020
- 1 min read
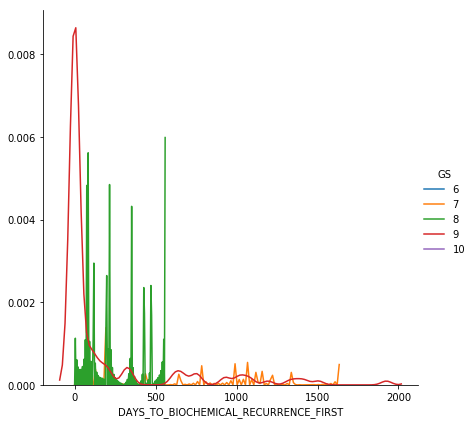
A machine learning approach to identify meaningful biomarkers by recognizing the possible patterns in the genes data given from the cBioPortal platform for the prostate cancer data. By having 495 different samples (patients) with 60K+ genes combinations, classification and feature selection, solving multi-class problems, dimensionality reduction, etc. techniques will be applied using clinical dataset along with the genes dataset. The visualization will be applied to follow up using seaborn and matplotlib libraries to bifurcate distinguished features using a different kind of maps and graphs. Right estimator algorithms are applied to test the accuracy to avoid the overfitting. Different classifiers are applied with the standard procedures and the accuracy is measured using cross-validation. The classifiers used in this scenario are Stochastic Gradient Descent (SGD), Support Vector Machine (SVM), Nearest Neighbours (NN), Naïve Bayes, Forest and tree methods. Hence, previously selected features using feature selection methods will be compared with the complete set of datasets. Each estimator has a different set of hyperparameters and using a different set of hyperparameters combinations using grid search approach over best performing classifier model.
Paper
Visualization: Clinical plots
Visualization: Genes plots


Comments